
A wireless, pocket-sized ECG biosensor, in comparison to standard 12 lead ECG in the detection of cardiovascular diseases in a tertiary care setting
Abstract
Background
The SanketLife is a low cost, portable, pocket-sized 12 lead ECG mechanized by the SanketLife app running on compatible iOS and Android phones that connect wirelessly via Bluetooth technology to the device.
Objective
The current study was conducted to assess the diagnostic accuracy of SanketLife ECG in comparison to standard 12 lead ECG (GE-2000) in the detection of cardiovascular diseases.
Research design and methods
This was a prospective diagnostic test accuracy trial conducted in outpatient settings of a tertiary cardiac care center in India. A total of 100 patients, attended cardiology OPD, were included in the study. Consecutive ECGs were taken by 12 lead standard ECG as well as by SanketLife ECG. Diagnostic accuracy variables such as sensitivity, specificity, negative and positive predictive value, negative and positive likelihood ratios were estimated. Ethical permission was taken from the Institutional ethical committee.
Results & conclusion
The analysis showed a high degree of agreement and accuracy of SanketLife in detecting major cardiovascular conditions (Major Minnesota codes) such as Left and right bundle branch block, ST-segment elevation and ST-segment depression, AV conduction block. SanketLife showed high sensitivity (98.15%) and specificity (100%) in diagnosing major cardiovascular conditions.
Delay in care and field triage
High incidence rate along with poor outcomes indicates the failure of the preventive measure at all levels from primary to tertiary in preventing cardiovascular mortality and morbidity. It is not only the sedentary lifestyle, inappropriate diet, the high prevalence of diabetes and hypertension but also poor management of acute cardiac events such as myocardial infarction, which set back efforts towards reducing premature mortality associated with CVDs.
According to a multi-center study [5] conducted in Punjab (India), 42% of all patients presenting with STEMI (ST-elevation myocardial infarction) at five different tertiary cardiac care centers were late by more than 6 h because of the pre-hospital delay. Delay was significantly associated with factors such as being elderly, rural residence and illiteracy. Recognizing symptoms as cardiac in origin, hospital as first medical contact, pre-hospital ECG was associated with shorter delays. Another study [6] by Ong Me advocated out of hospital ECG and transmission to higher centers as the best practice for chest pain management. This study estimated a significant reduction in the door to balloon times in patients with acute STEMI with the help of out of hospital 12 lead ECG recording and transmission. A tertiary care hospital-based study [7] in Srinagar estimated that 44.7% of acute STEMI reported late to the hospital because of misdiagnosis by local healthcare providers. Rural residence, referral, and transport delay were among other important reasons.
SanketLife role as a biosensor in early detection of myocardial infarction
Biosensors along with artificial intelligence and machine learning have been projected for long as the future of cardiac care [12]. Marjan Gusev in his article [13] presented the framework of using ECG as a biosensor in as heart attack alerting system. This system consisted of a small portable ECG biosensor placed at the patient’s body and an application installed in the smartphone, which can receive ECG signals and transmit them to the data centre and also a web application on the cloud. The data centre can detect any abnormal heart activity, while the cloud-based application can convey it to the doctors in charge of providing 24-h medical services. Another similar article [14] also described the detection of heart attack by using a wearable ECG sensor and a mobile phone. SanketLife ECG works on similar line as a biosensor in the detection of electrical abnormalities and communicating those to the data centre through an application installed in the smartphone.
Results: data analysis
The total sample size on which analysis conducted, was 91 because of the poor quality of reports. All subjects were male with a mean age of 52.02 years (SD: 14.04) and median of 55. Age of subjects ranges from 24 to 91 years. Matching was done between Minnesota codes assigned to ECG findings of SanketLife and standard 12 lead ECG. Individual codes (a few cases had more than one code) were matched.
Abnormal Q waves (Minnesota code:1-1-6) were infrequent and reported in only one case by both types of ECGs. (Table 1) Left axis deviation was reported in two cases with 100% matching of results. In Minnesota code 3 (High amplitude R waves) similar findings were reported by SanketLife as of standard 12 lead ECG in 9 cases. Though in 2 cases, where 12 lead ECG shows normal R waves, SanketLife showed high amplitude R waves.
able 1. ECG (Standard and SanketLife) findings (Minnesota code wise).
| ECG findings | Number Of subjects |
Minnesota coding (SanketLife) | Minnesota coding (12 lead standard) | Matching | Comme nt |
|---|---|---|---|---|---|
| Q waves (Code:1) | |||||
| Small Initial R wave in V1 and V2 lead | 1 | 1-1-6 | 1-1-6 | Yes | |
| Axis deviation (2) | |||||
| Left | 2 | 2–1 | 2–1 | Yes | |
| High Amplitude R waves (3) | |||||
| Left type | 8 | 3–1 | 3–1 | Yes | |
| Left type | 2 | 3–1 | Normal | No | |
| Right type | 1 | 3–2 | 3–2 | Yes | |
| ST depression (4) | |||||
| STJ depression ≥ 2.0 mm and ST segment horizontal or downward sloping in any of leads I, aVL, or V6 | 8 | 4-1-1 | 4-1-1 | Yes | |
| STJ depression ≥ 1.0 mm but < 2.0 mm, and ST segment horizontal or downward sloping in any of leads I, aVL, or V6. |
2 | 4-1-2 | 4-1-2 | Yes | |
| STJ depression ≥1.0 mm but < 2.0 mm, and ST segment horizontal or downward sloping in any of leads I, aVL, or V6 |
10 | 4–4 | 4–4 | Yes | |
| STJ depression ≥1.0 mm and ST segment upward sloping or Ushaped, in any of leads I, aVL, or V6. | 2 | 4–4 | No upward sloping ST segment | No | |
| T wave negativity (5) | |||||
| Negative T-wave in Lead I, II & V5 V6 |
27 | 5–2 | 5–2 | Yes | |
| Flat T wave in V1 and Positive T wave in V2 | 2 | 5–3 | 5–3 | Yes | |
| Flat T wave in V1 and Positive T wave in V2 | 2 | 5–3 | 1.Negative T wave in V1 & Flat T wave in V2 2. Normal R wave 3 |
No | |
| 1 | No 5-3 | 5–3 | No | ||
| AV conduction defect (6) | |||||
| Wenckebach’s Phenomenon (P-R interval increasing from beat to beat until QRS and T dropped) | 3 | 6-2-3 | 6-2-3 | Yes | |
| Ventricular blocks (7) | |||||
| Left bundle branch block | 2 | 7-1-1 | 7-1-1 | Yes | |
| Right bundle branch block | 2 | 7-2-1 | 7-2-1 | Yes | |
| Intraventricular conduction delay | 2 | 7–4 | 7–4 | Yes | |
| Arrythmias (8) | |||||
| Atrial or junctional premature beats | 1 | 8-1-1 | Normal | No | |
| Atrial or junctional premature beats | 1 | Normal | 8-1-1 | No | |
| Ventricular premature beats | 3 | 8-1-2 | 8-1-2 | Yes | |
| Ventricular premature beats | 5 | 8-1-2 | Normal | No | |
| Atrial fibrillation (Persistent) | 1 | 8-3-1 | 8-3-1 | Yes | |
| Low QRS amplitude (9-1) | 1 | 9–1 | 9–1 | Yes | |
| ST segment elevation (9-2) | |||||
| 16 | 9–2 | 9–2 | Yes | ||
| Hyperacute T wave (9-5) | |||||
| 7 | 9–5 | 9–5 | Yes | ||
| Normal ECGs | |||||
| 10 | Normal | Normal | Yes | ||
ST depression (4-1-1, 4-1-2, 4-4) was reported in 22 ECGs by the standard as well as SanketLife with mismatching in two ECGs where 12 lead standard ECG was normal while SanketLife found ST junction depression (Code 4-4). Out of 32 cases, the pattern of T waves were similar in 29 cases in both type of ECGs. Atrio-ventricular defects and ventricular block were reported in 9 cases with 100% matching. ST-segment elevation and Hyperacute T waves also reported by both type of ECGs among 23 cases with 100% matching. In Minnesota coding category 8 (Arrhythmia), there is a total of 11 cases. There was a lack of agreement in both the cases of atrial premature beats and four cases of premature ventricular beats.
3.1. Major and minor ECG abnormalities (Table 2)
Minnesota coding has been extensively used in population studies of ECG abnormalities and trials. Several studies classified ECG finding into major and minor abnormalities by using Minnesota code.
Table 2. Distribution of Minnesota codes in sample subjects.
| Type of ECG abnormalities | Minnesota Code | Prevalence N (%) |
|---|---|---|
| Major ECG abnormalities | ||
| ST depression | IV1-2 | 10 (10.9) |
| T wave inversion | V 1-2 | 26 (28.5) |
| Complete or second-degree AV block | VI 1-2 | 3 (3.3) |
| Complete left or right bundle branch block | VII 1-2 | 4 (4.4) |
| Frequent premature beats | VIII 1 | 10 (10.9) |
| Atrial fibrillation | VIII 3 | 1 (1.1) |
| Minor ECG abnormalities | ||
| Borderline Q wave | I 3 | 0 (0) |
| Left or right axis deviation | II 2 | 0 (0) |
| QRS high voltage | III 1-2 | 11 (12.1) |
| Borderline ST segment depression | IV 3 | 0 (0.0) |
| T wave flattening | V 3 | 7 (5.5) |
| QRS low voltage | IX 1 | 1 (1.1) |
| Myocardial ischaemia (Ischaemic ECG) | ||
| Presence of Q/QS patterns | I 1-3 | 1 (1.1) |
| Significant or borderline ST segment depression | IV1-3 | 10 (10.9) |
| Deep or moderate T wave inversion | V 1-3 | 31 (34.1) |
| Evidence of complete left bundle branch block | VII 1 | 2 (2.2) |
According to a Chinese study [16], major abnormalities have included Minnesota codes as 1-1, 1-2, 4-1, 4-2, 5-1, 5-2, 6-1, 6-2, 7-1, 7-2, 7-4, 8-1 and 8-3 and minor abnormalities were defined as ECGs without any major abnormality and Minnesota codes 1-3, 2-1, 2-2, 3-1, 3-2, 4-3, 5-3, 6-3, 9-1. Belgian interuniversity research on Nutrition and Health (BIRNH) study [17] classified ECG findings into major and minor.
3.2. Estimation of diagnostic accuracy
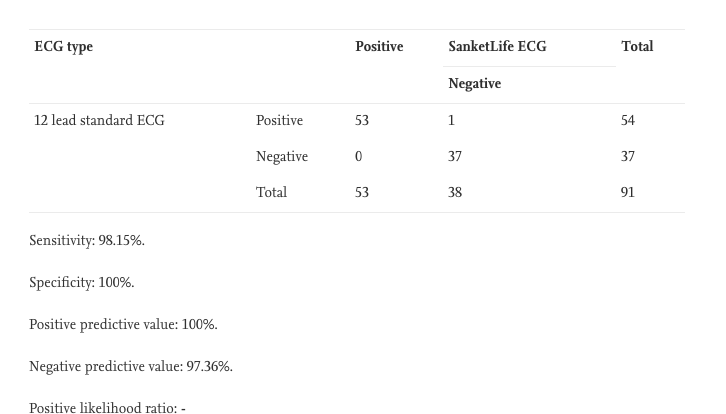
Sensitivity, specificity, positive and negative predictive value, the positive and negative likelihood ratio for SanketLife ECG in comparison to standard 12 lead ECG was calculated for major and ischaemic ECG findings. (Table 3) Overall findings have combinations such as only major code, only minor code and both major and minor codes together. For the analysis purpose, in cases where both major and minor codes were reported together, only major codes were considered. Minor codes and time variant ECG findings such as atrial and ventricular premature beats were not taken into account for matching. Out of total 91 subjects, 53 major codes were accurately detected by SanketLife.
Table 3. Diagnostic accuracy parameters of SanketLife.
| ECG type | Positive | SanketLife ECG | Total | |
|---|---|---|---|---|
| Negative | ||||
| 12 lead standard ECG | Positive | 53 | 1 | 54 |
| Negative | 0 | 37 | 37 | |
| Total | 53 | 38 | 91 | |
Sensitivity: 98.15%.
Specificity: 100%.
Positive predictive value: 100%.
Negative predictive value: 97.36%.
Positive likelihood ratio: –
Negative likelihood ratio: 0.02.
Download Full PDF
Nice respond in return of this query with genuine arguments and explaining everything about that.